Debugging the Hello World App (Android)
Goals
As a developer you can compile your envoy-mobile repository and the generated .aar will be automatically recognized by Android Studio
envoy-mobile can be compiled to a single arch for debugging
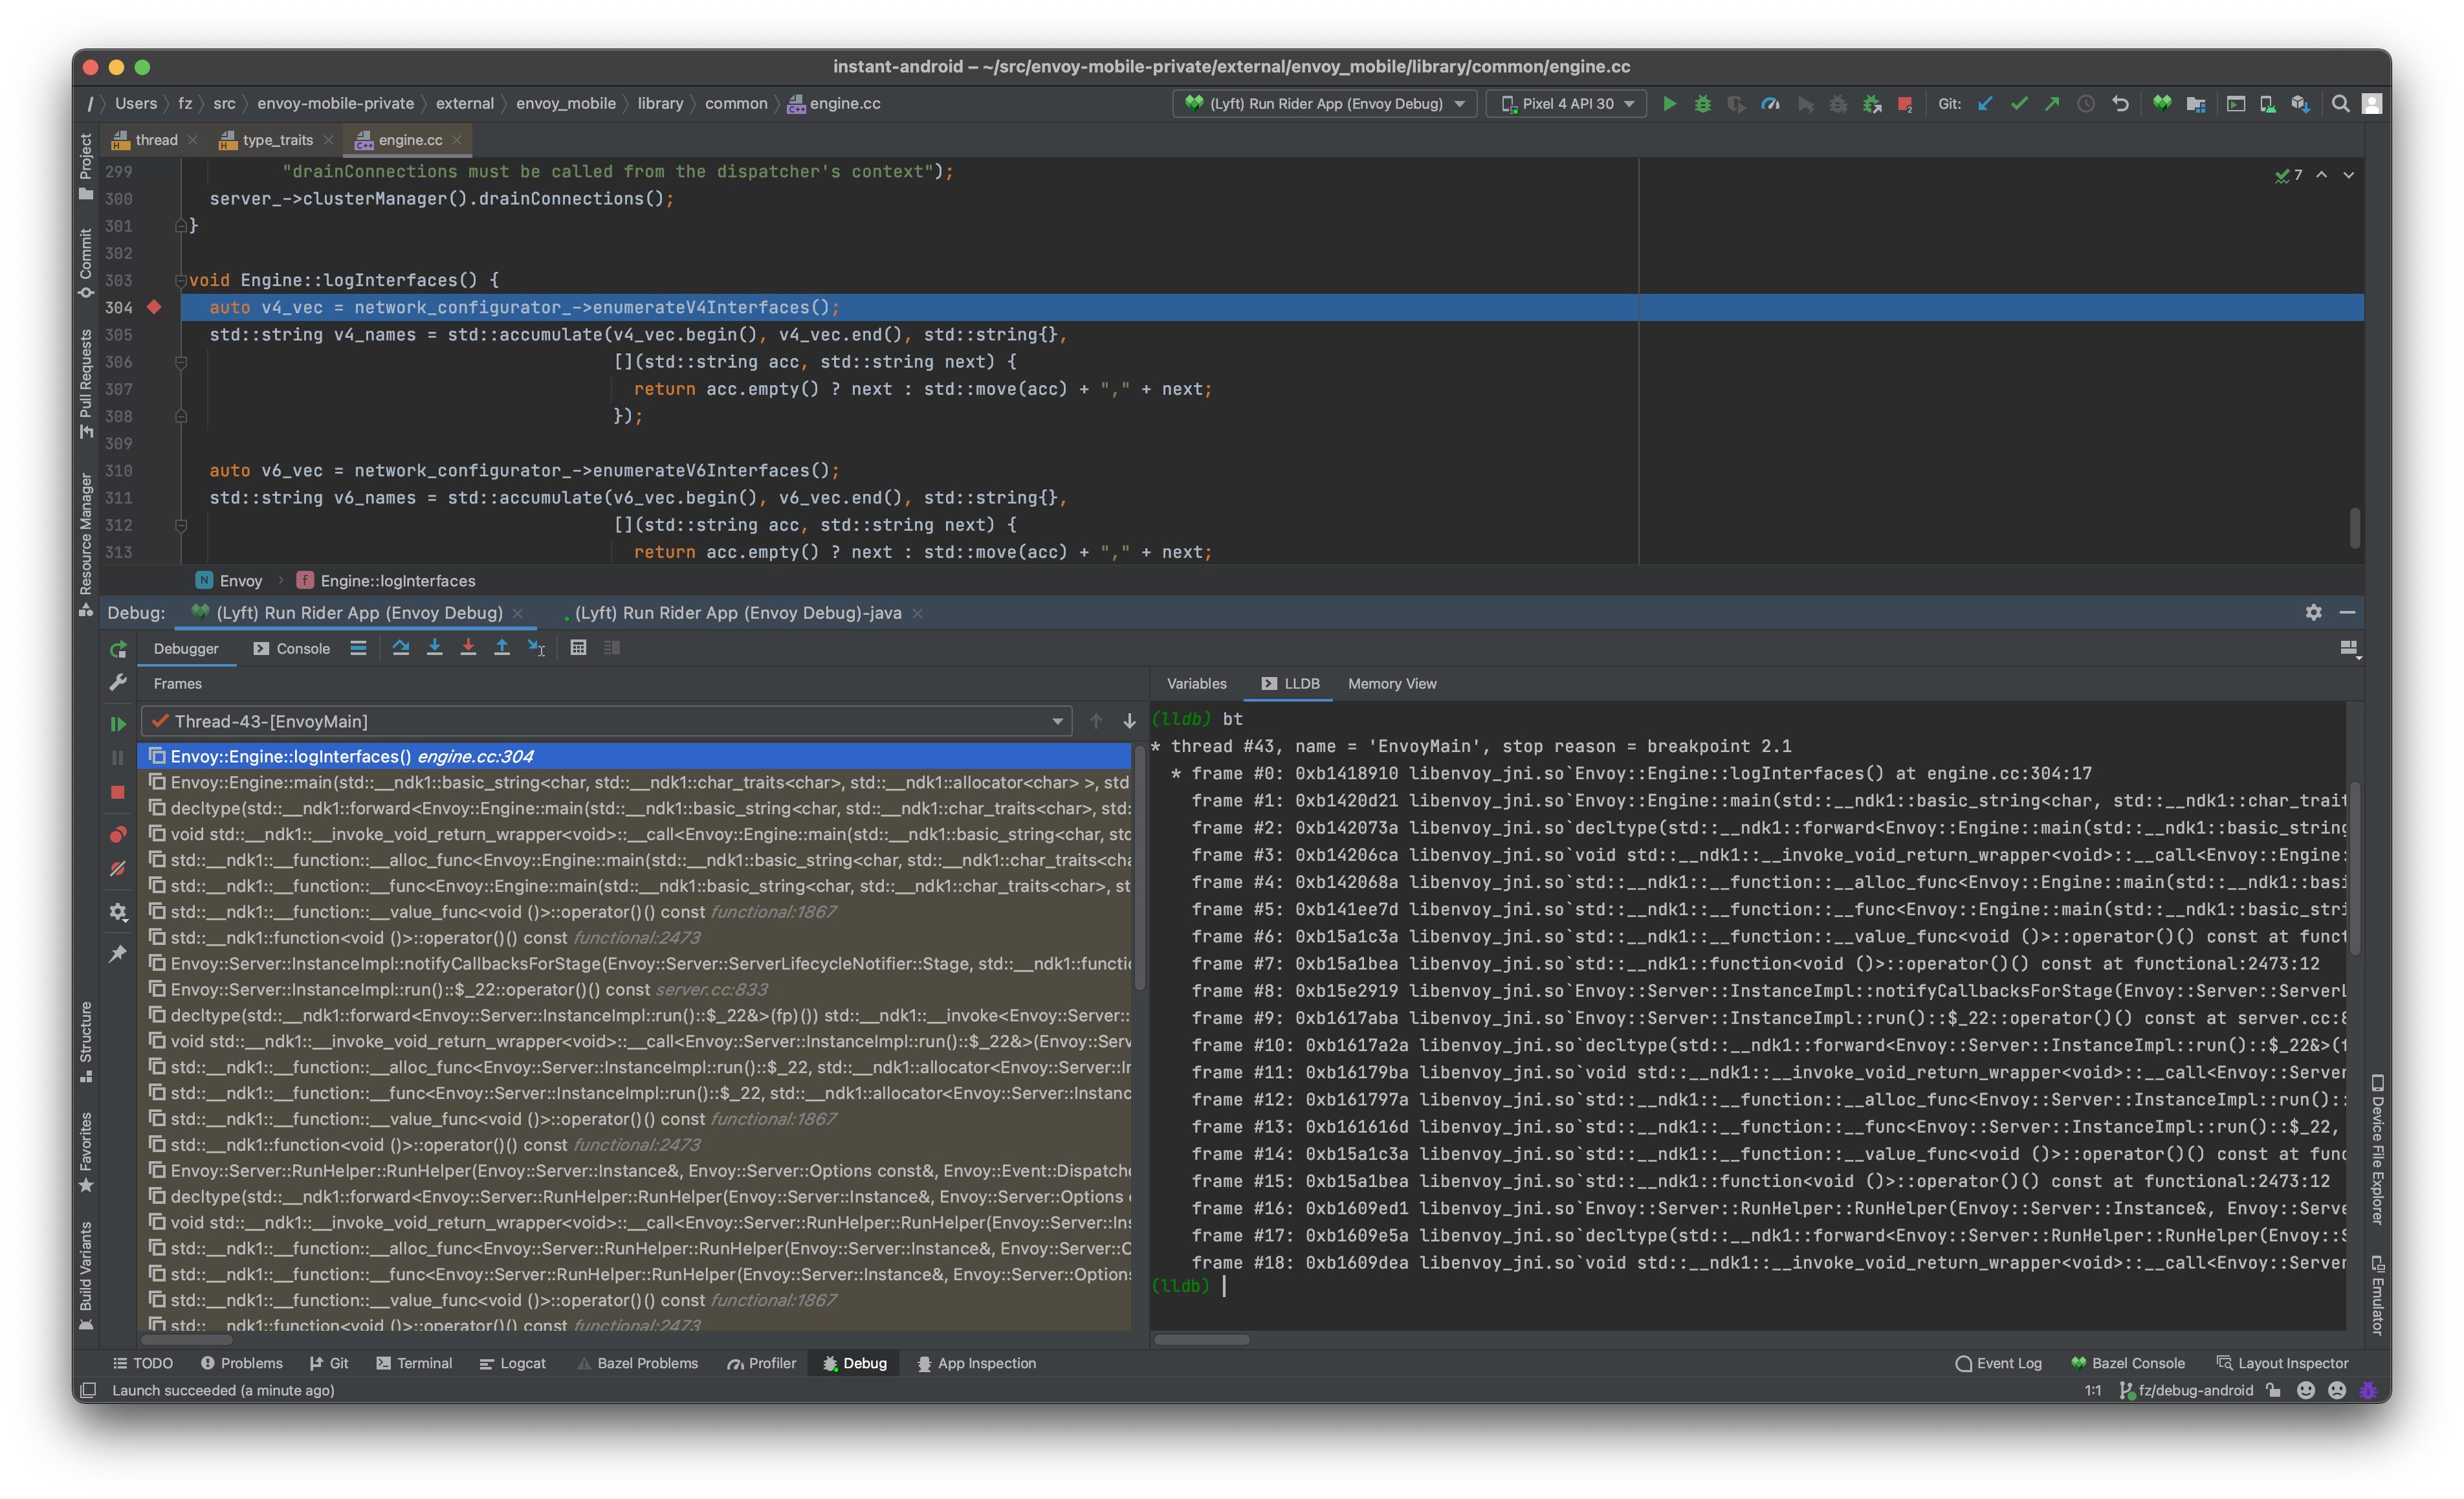
While breaking on a C++ function, Android Studio should present the source file and highlight the line where the breakpoint hit with all scope information
The workflow works both on emulator and device
Setting up the environment
Before we start, you’ll need to download Android Studio and the Bazel plugin, you can find it in Preferences -> Plugins .
Go here and install Android Studio
Install the bazel plugin
Adding Envoy-Mobile Project into Android Studio
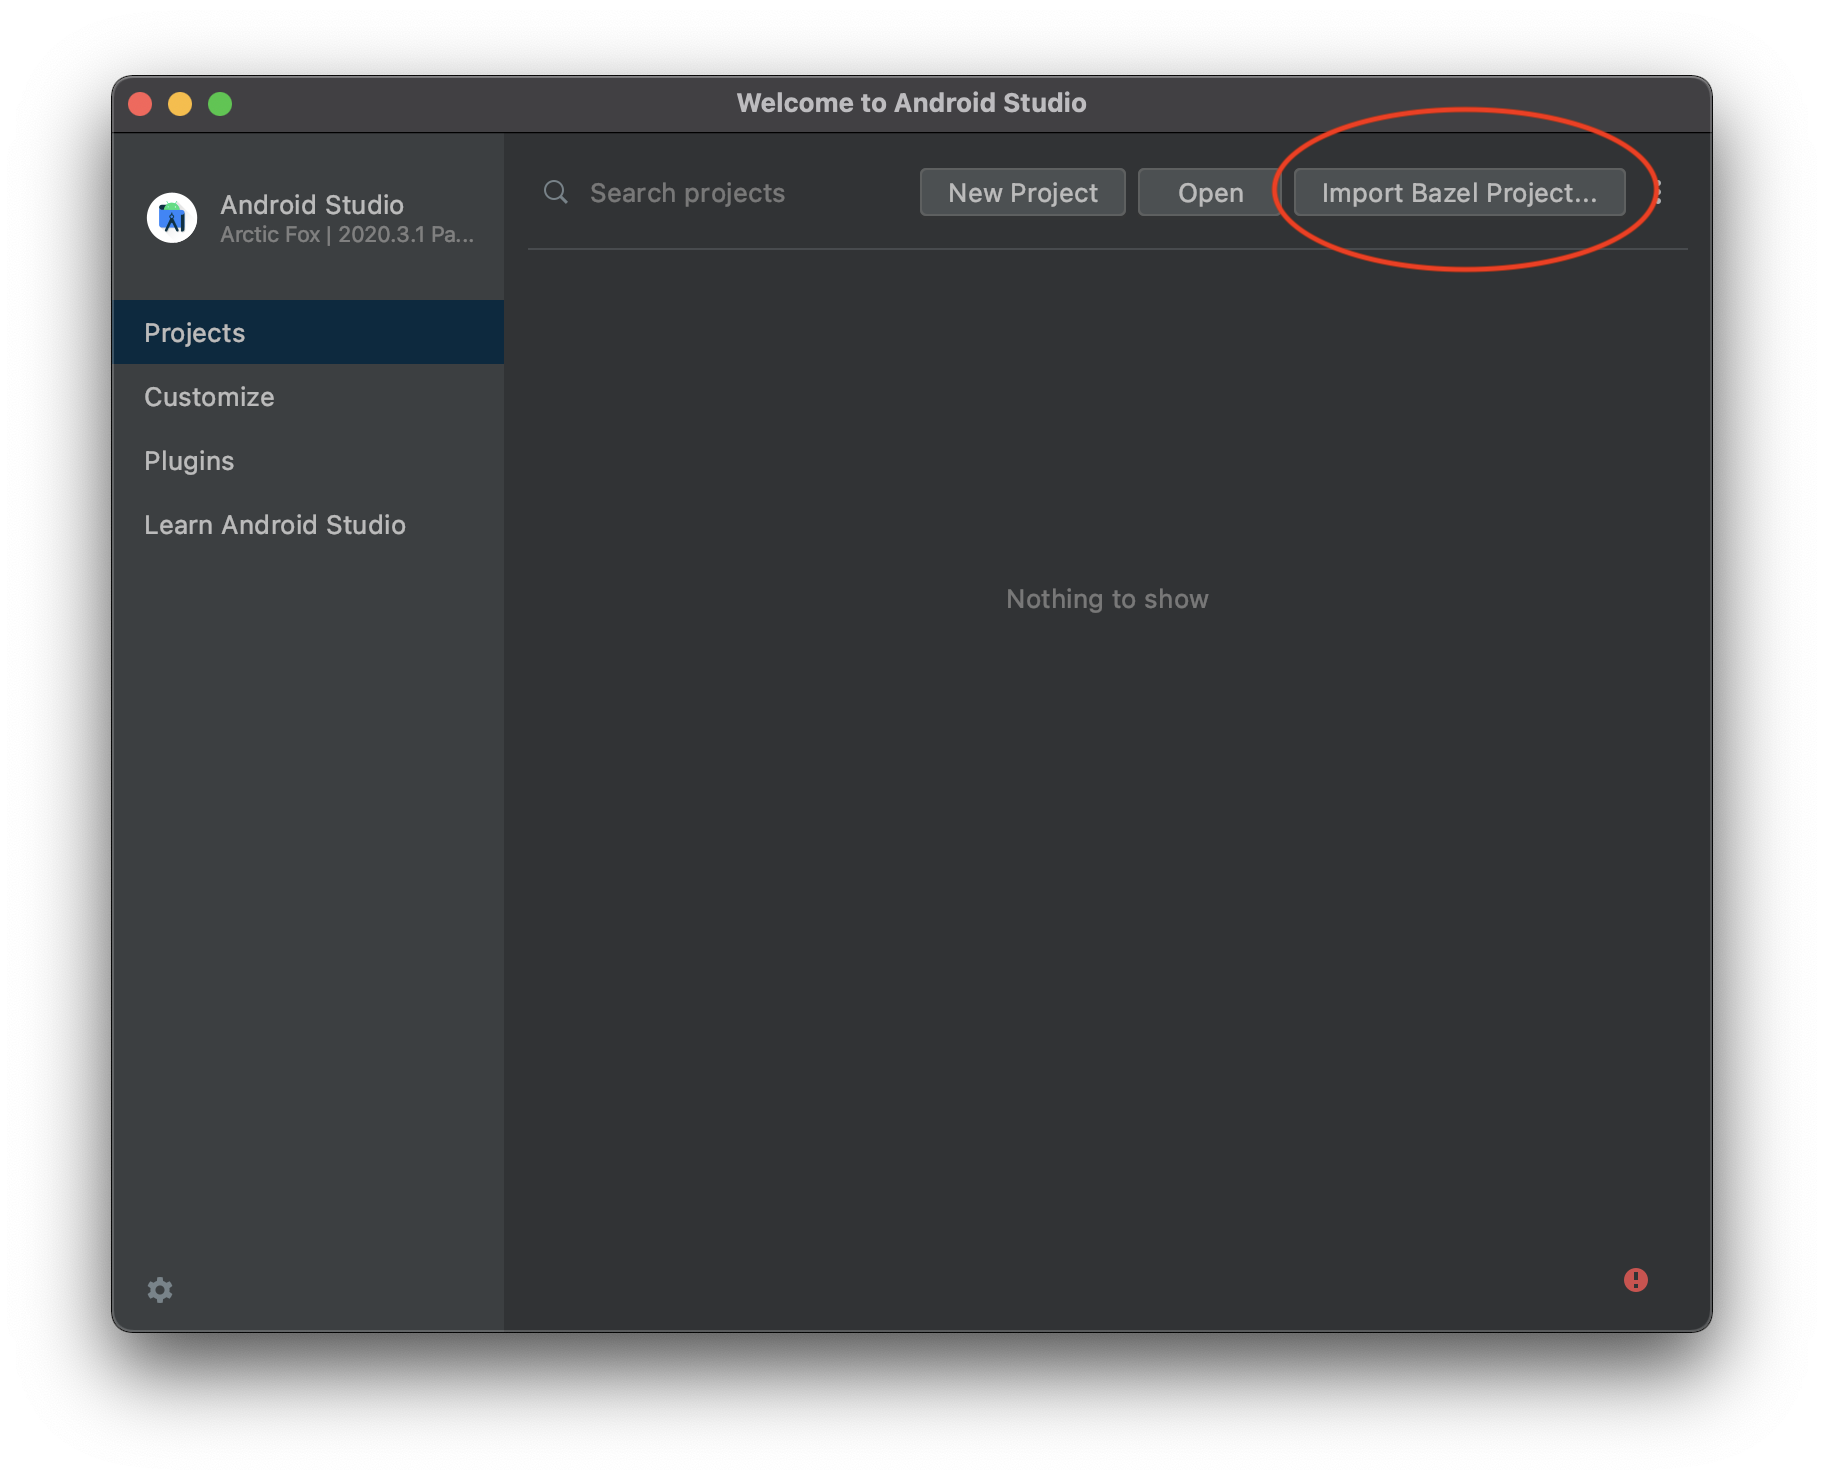
With your environment setup, open Android Studio.
Add a new bazel project by clicking here:
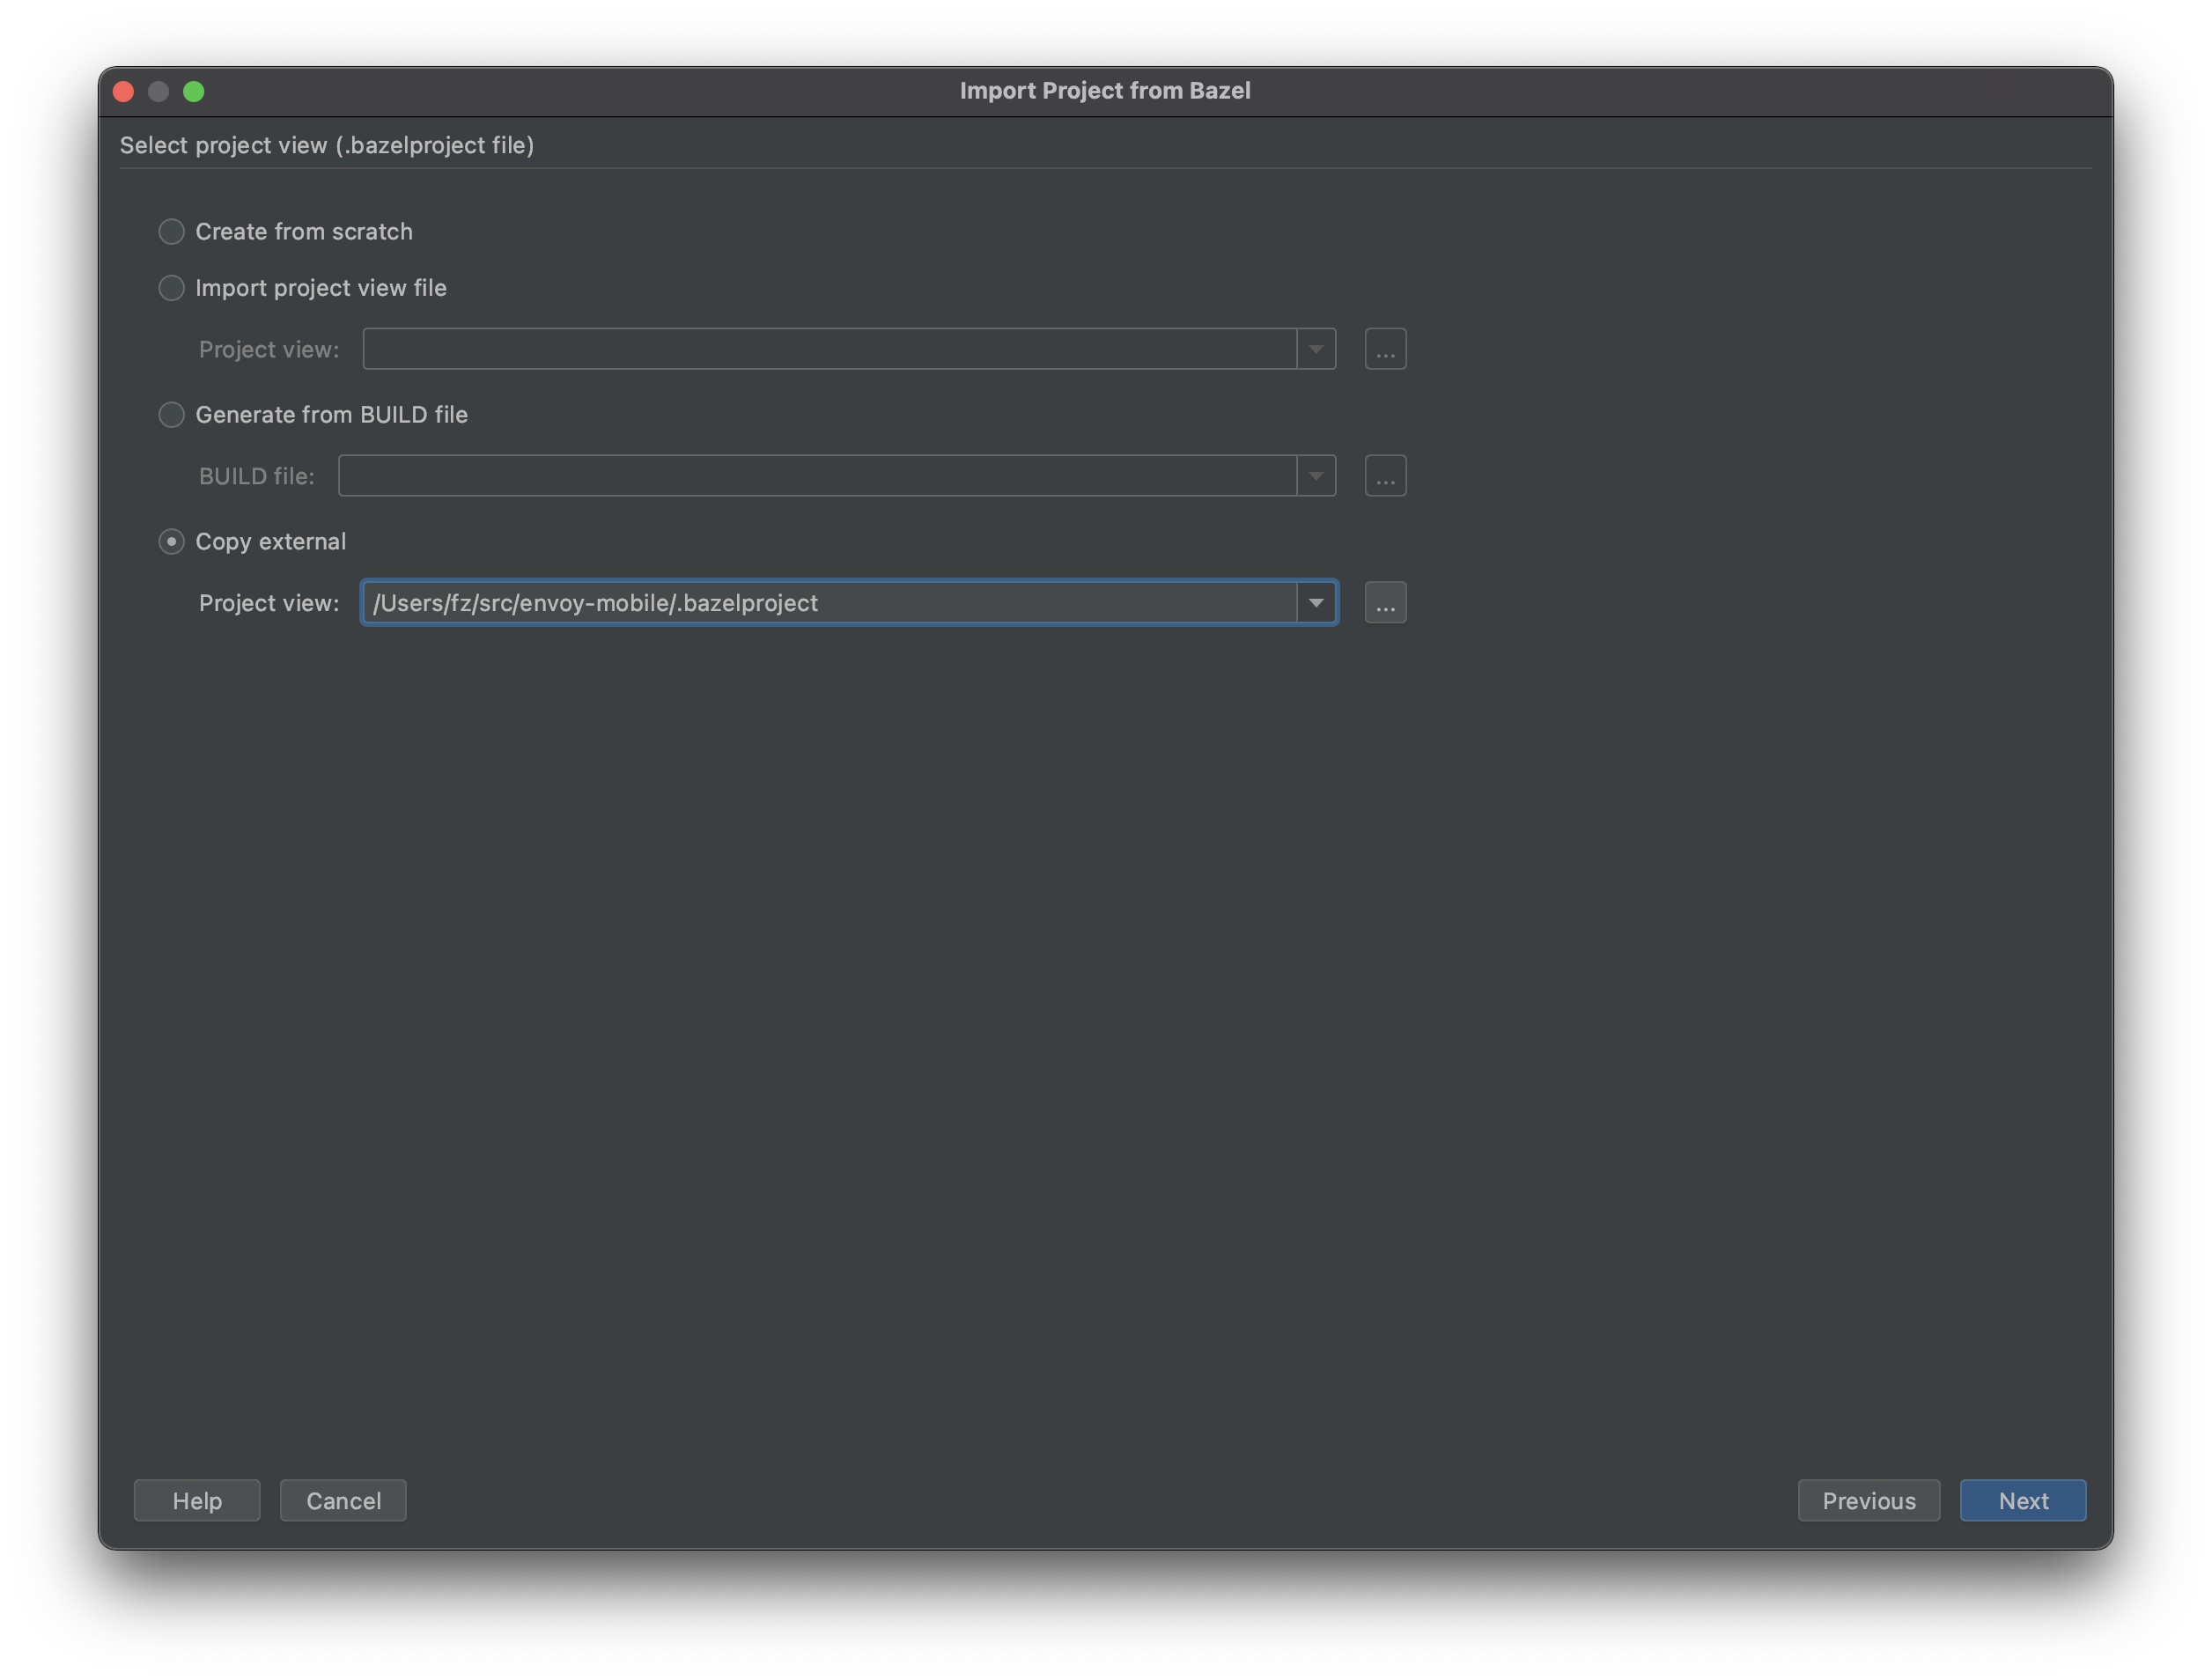
Select your repository root path as follows and hit Next:

Import the bazelproject file from the root and hit Next:
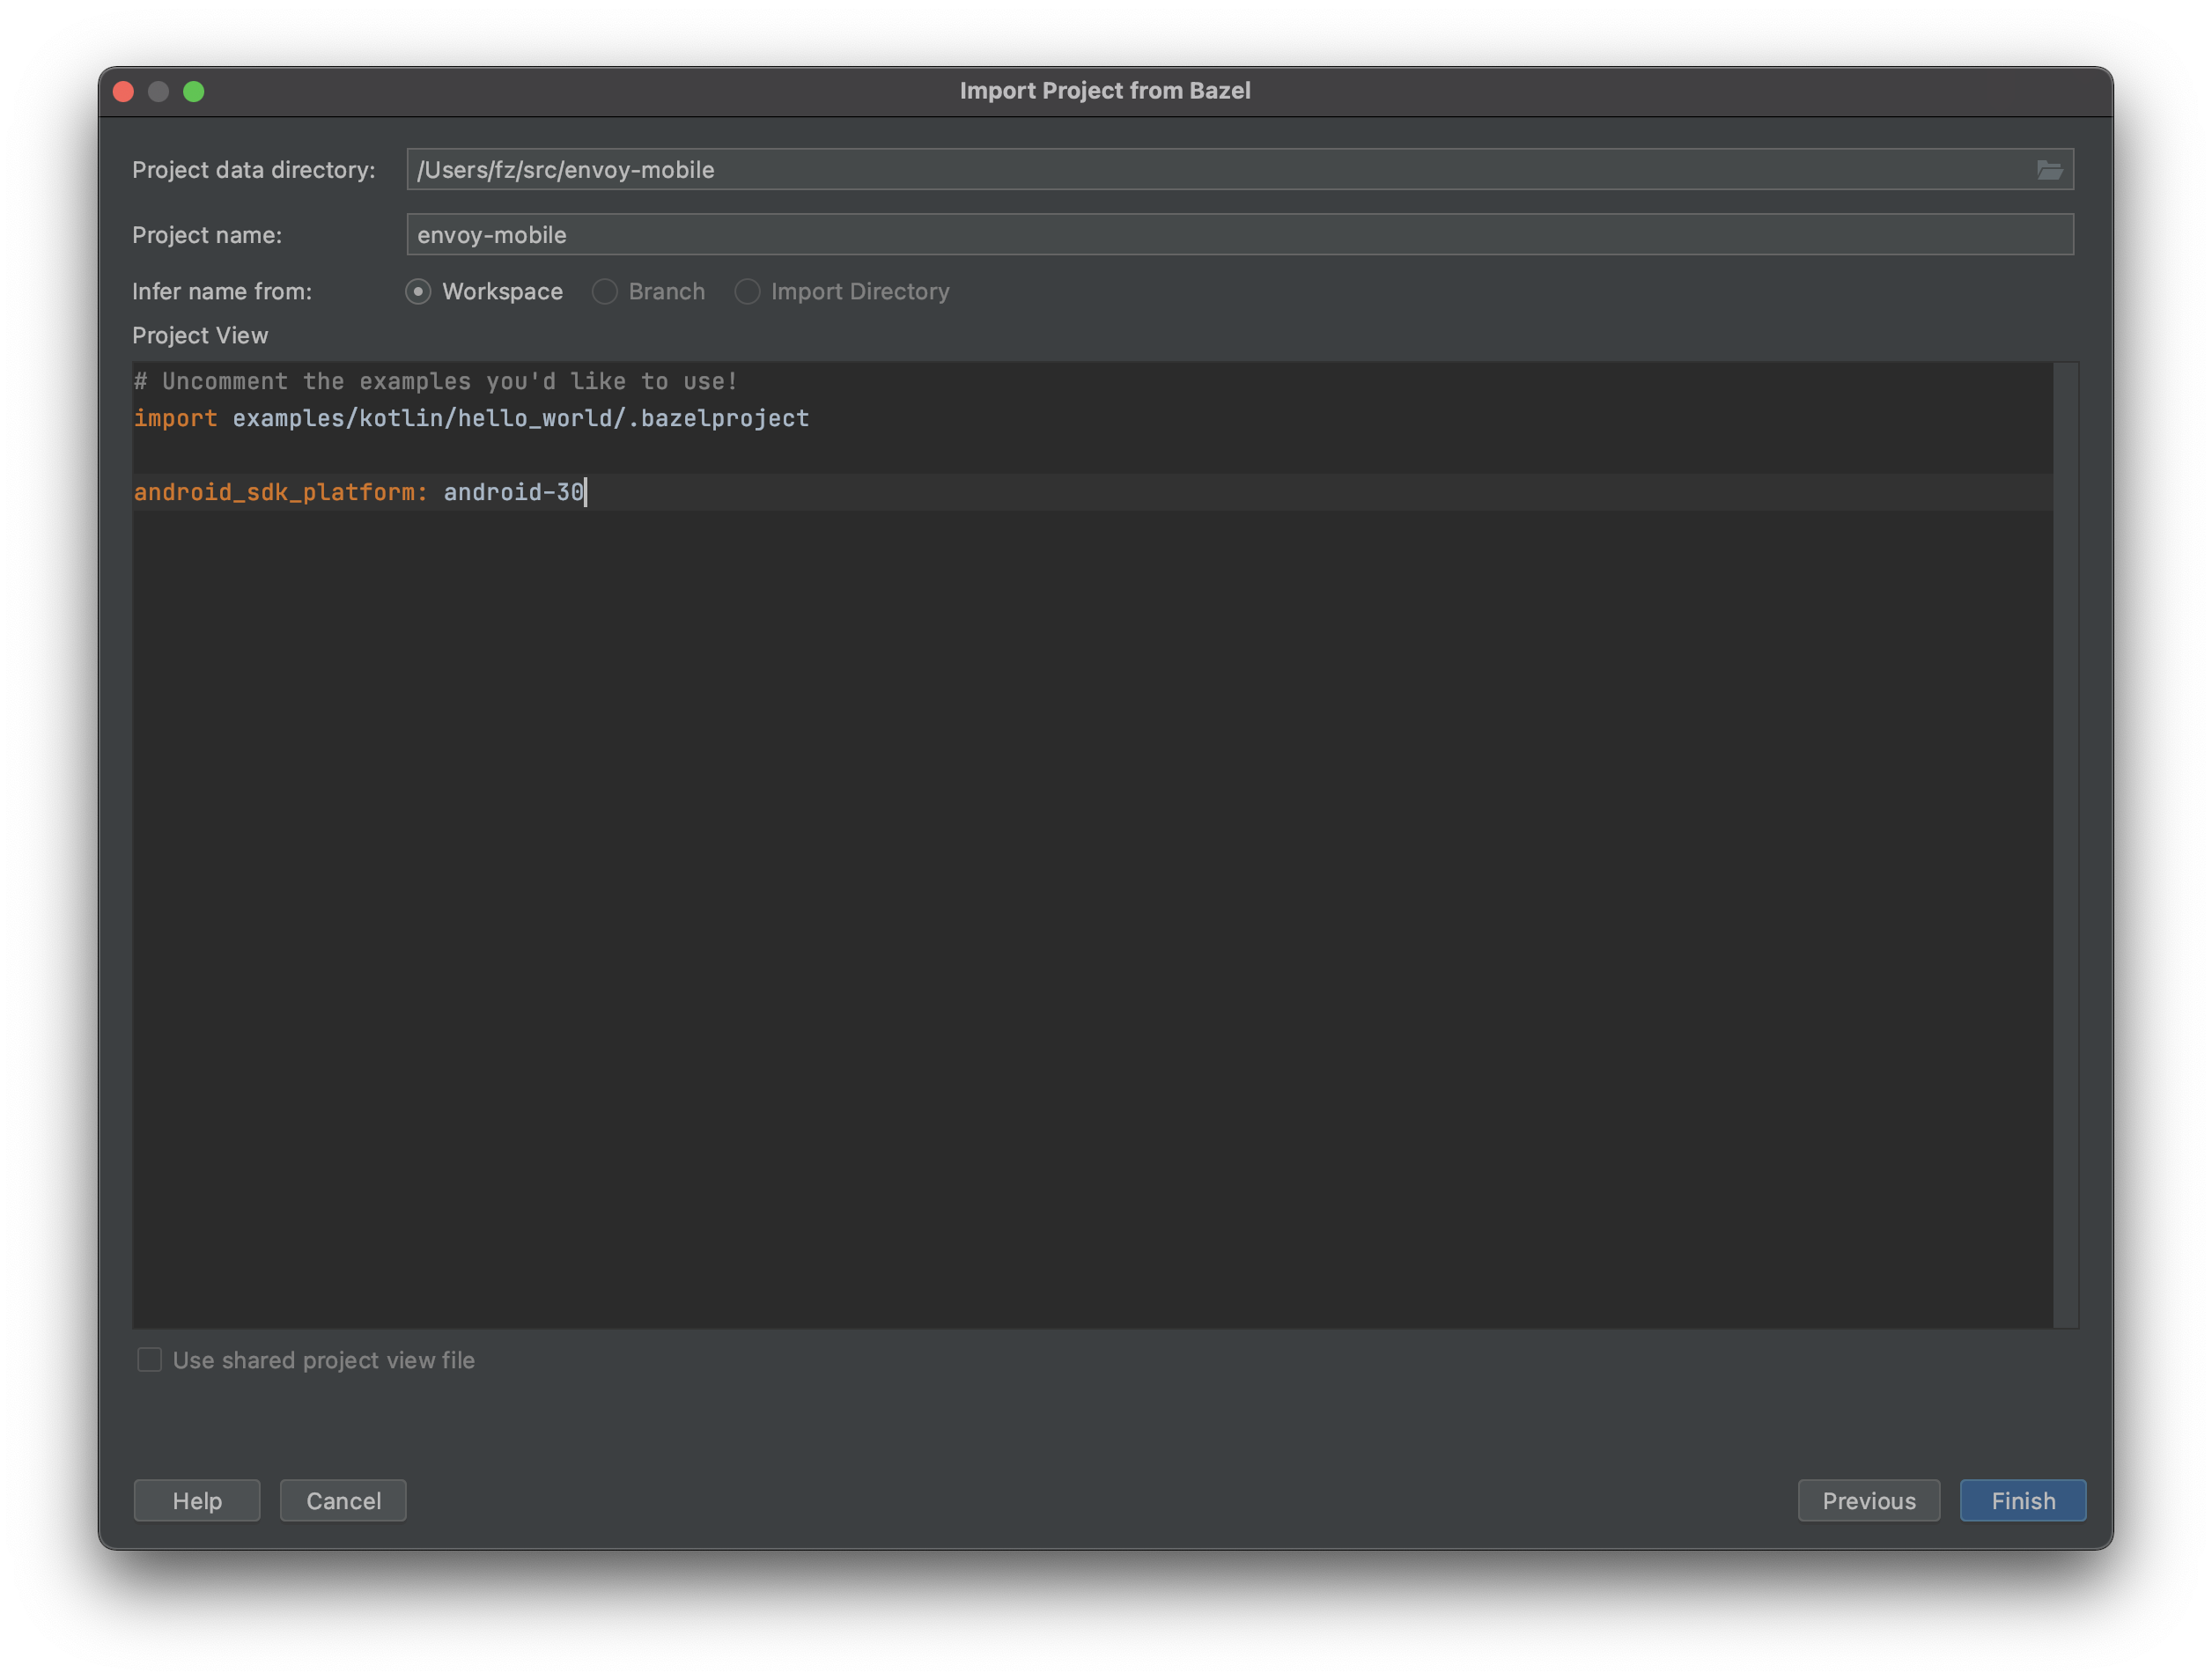
You’ll see a screen similar to this. Click Finish.
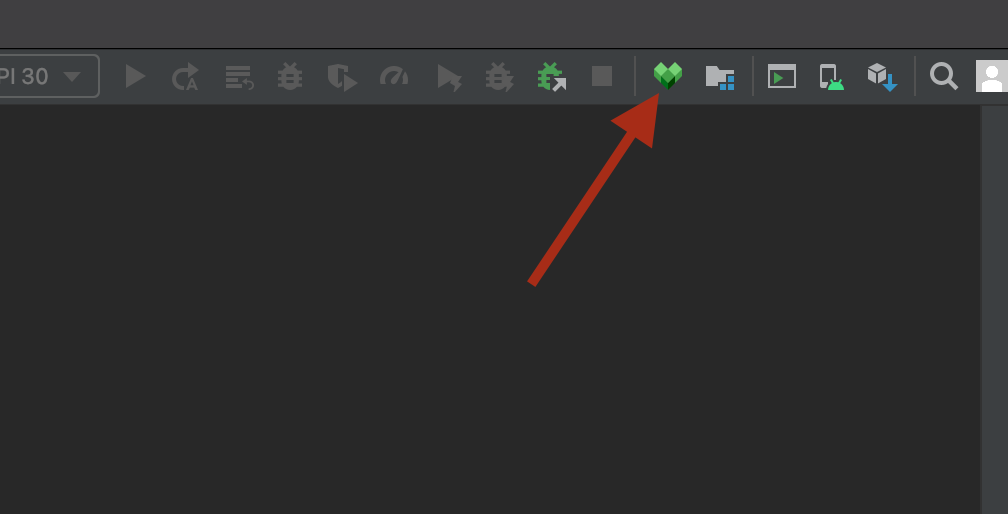
Once Android Studio completes loading click on the Bazel Sync icon:
Entering a debugging session
With the project ready, you can now start debugging with Android Studio.
From Android Studio select one of the available configurations e.g., Example App (Debug) [x86] or Example App (Debug) [arm64]. Note: x86 configurations don’t work on ARM machines (i.e., M1 Macbooks).
Hit the debug icon. Note: if you don’t see this option go to “Add configuration” and it’ll be there on the Bazel category, just select it and hit Ok.
Optionally you could create symbolic breakpoints before running by going to the Debugger tab.
Your environment should look like this at this point: